Datavisual is a web-based tool that gives designers and creatives with limited programming skills the ability to easily create beautiful data visualizations. Though there are other options for creating data visualizations, none of them provide a simple GUI that allows users to generate visualizations for the web and print. You may also design using Illustrator if you like. Once you have finished designing your chart style, upload multiple data sets and output them in batches as PDFs, SVGs, PNGs and dynamic JavaScript files. I’ve worked as a graphic designer and created this tool with graphic designers in mind. This website can save months of production time, producing hundreds of manually drawn visualizations in just minutes.
Concept / Design / Development / Marketing / Business Development
Demo Video
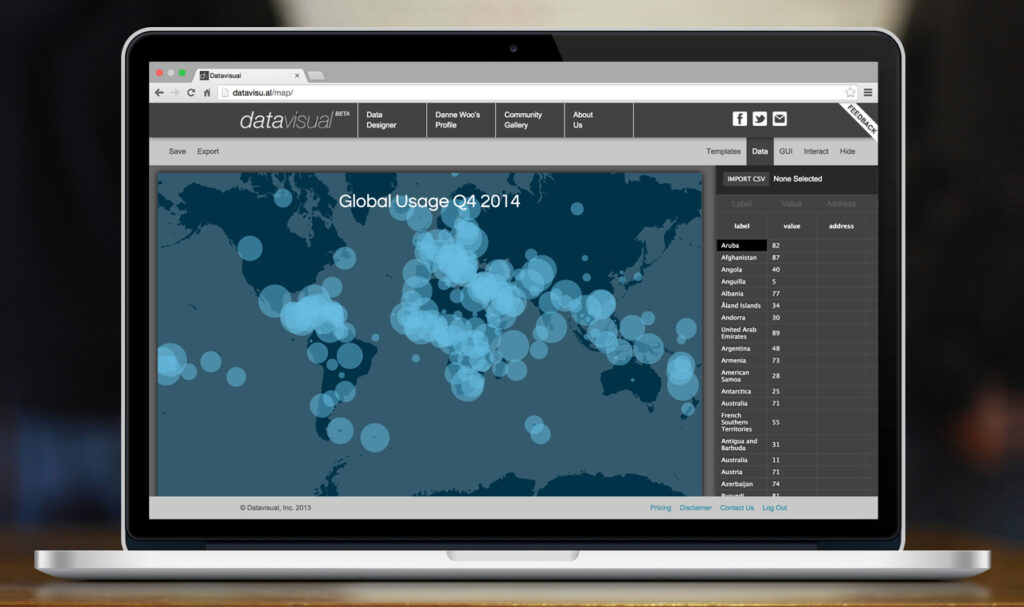
Simple Graphic User Interface
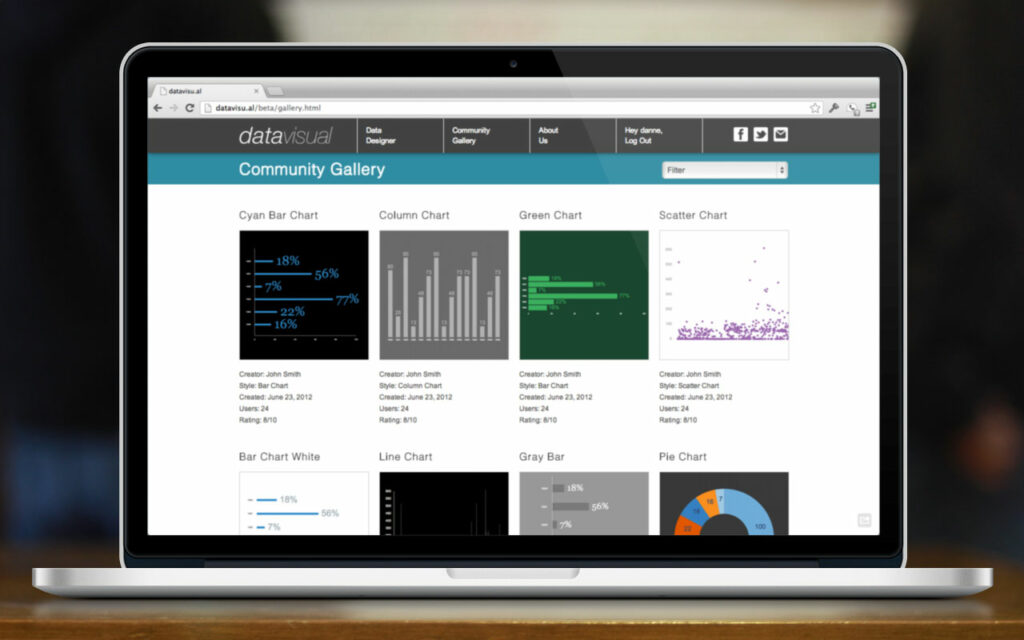
Community Gallery to Share Chart Designs
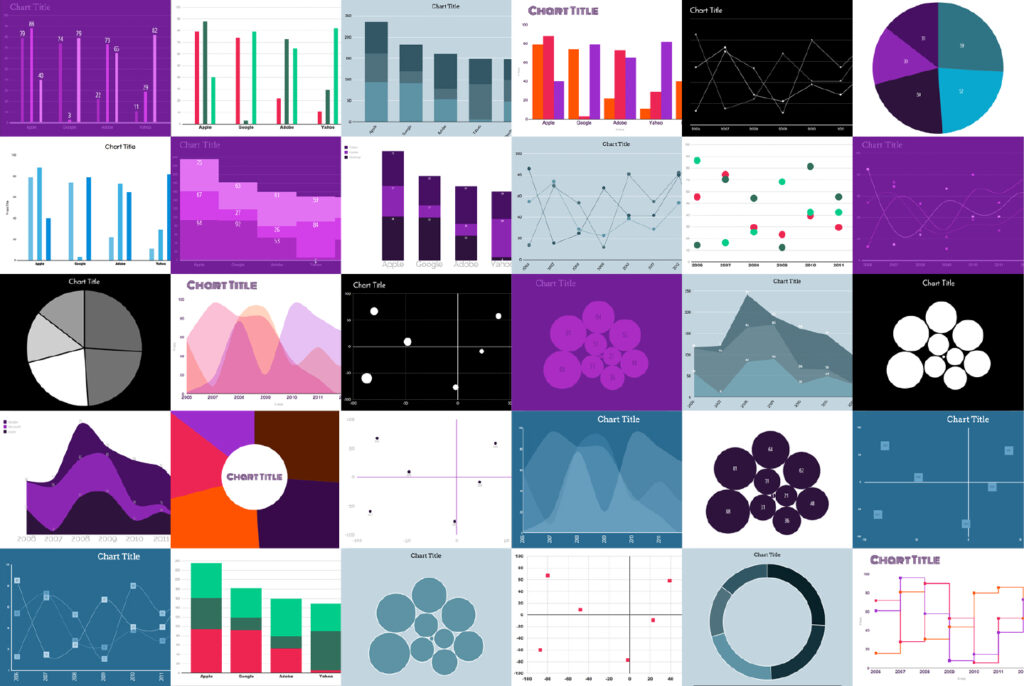
Example Charts Exported from Datavisual